Solving Systems of Linear Equations by Graphing
Learning Objective(s)
· Describe the creation and use of systems of equations.
· Graph a system of linear equations on the coordinate plane and identify its solution.
Introduction
Sometimes graphing a single linear equation is all it takes to solve a mathematical problem. Other times, one line just doesn’t do it, and a second equation is needed to model the situation. This is often the case when a problem involves two variables. Solving these kinds of problems requires working with a system of equations, which is a set of two or more equations containing the same unknowns.
Let’s take a look at systems of equations, and see what the graphs of individual equations within a system reveal about the mathematical relationship of the variables.
A system of equations contains two or more linear equations that share two or more unknowns. To find a solution for a system of equations, we must find a value (or range of values) that is true for all equations in the system.
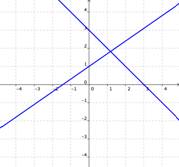
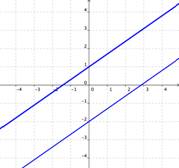
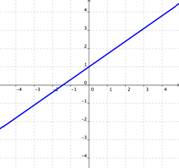
The graphs of equations within a system can tell us how many solutions exist for that system. Look at the images below. Each show two lines that make up a system of equations (in the graph on the right the two lines are superimposed and look like a single line). How many points in common does each system of lines reveal?
| One Solution | No Solutions | Infinite Solutions |
|
|
|
|
| If the graphs of the equations intersect, then there is one solution that is true for both equations.
| If the graphs of the equations do not intersect (for example, if they are parallel), then there are no solutions that are true for both equations. | If the graphs of the equations are the same, then there are an infinite number of solutions that are true for both equations. |
Remember, the graph of a line represents every point that is a possible solution for the equation of that line. So when the graphs of two equations cross, the point of intersection lies on both lines, meaning that it is a possible solution for both equations. When the graphs of two equations never touch, there are no shared points and there are no possible solutions for the system. When the graphs of two equations lie on top of one another, they share all their points and every one is a possible solution.
Graphing equations in order to identify a specific point of intersection is usually not a precise way to solve systems because it is often difficult to see exactly where two lines intersect (unless you are using a computer-based graphing program that allows you to zoom in on a point). However, the graph of a system of equations can still give a good idea of what type of solution, if any, exists. Let’s graph a system, and see how it works.
Graph the system y = 3x and x + 2y = 4. How many solutions does this system have?
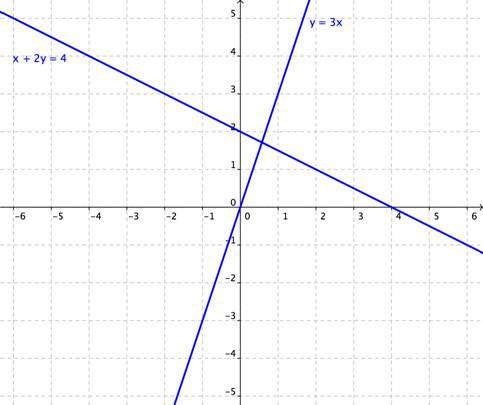
A graph of the two lines y = 3x and x + 2y = 4 shows us that the lines intersect, meaning that there is a single (x, y) value that satisfies both equations. Looking at the graph does not tell us exactly where that point is, but we don’t need to know that information here, because the question only asks for the number of solutions.
So a system made of two intersecting lines has one solution. Now let’s look at a different situation:
How many solutions exist for the system y -0.5x = 7 and 2y = x − 3?
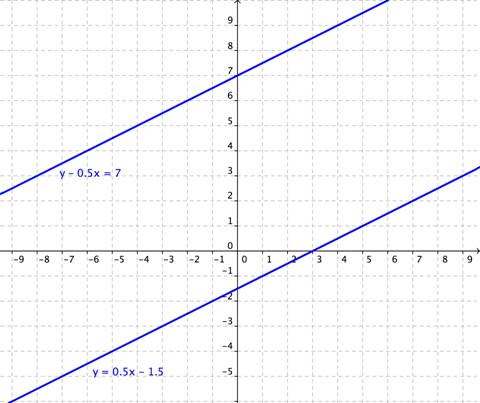
Plotting both equations, it looks like there is no solution—the lines are parallel. To check this finding, we can compare the slopes of the equations. To make that easy, we’ll rearrange the equations into slope-intercept form, or y = mx + b. That gives us the equations y = 0.5x + 7 and y = 0.5x − 1.5. Yes, the slope of both lines is 0.5, which means the lines really are parallel. They never intersect, so there is no point that lies on both lines, and no solution to the system.
Micaela is trying to find the number of possible solutions for a system of two linear equations. She draws the following graph, which accurately shows parts of the two lines in the system. What can she conclude?
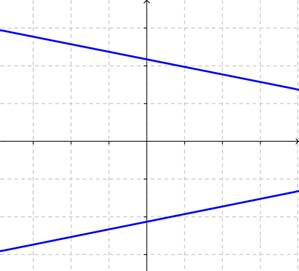
A) The system has no solutions.
B) The system has one solution.
C) The system has two solutions.
D) The system has infinite solutions.
Graphing a Real-World Context
Systems may be written differently when they are applied to real-world situations, but a solution for the system must still be a set of values that is true for all equations. Let’s use a basketball example to explore a system of equations.
In yesterday’s basketball game, Cheryl scored 17 points with a combination of 2-point and 3-point baskets. The number of 2-point shots she made was one greater than the number of 3-point shots she made. How many of each type of basket did she score?
In this problem, there are two relationships that share a set of common unknowns. We can think of the first relationship as “the number of points Cheryl scored = the number of 2-point baskets + the number of 3-point baskets.” The other relationship is “(the number of 2-point baskets) − 1 = the number of 3-point baskets.” Notice that in both relationships, the two unknowns are the same: the number of 2-point baskets, and the number of 3-point baskets.
Relationship 1: The number of points Cheryl scored = the number of 2-point baskets + the number of 3-point baskets
Relationship 2: (The number of 2-point baskets) − 1 = the number of 3-point baskets
Let’s begin with the first relationship. We know that Cheryl scored 17 points, so we can insert that into the left-hand side of the equation. Now we have to find some combinations of 2- and 3-point baskets that will add up to a total of 17 points. We can use a simple table to record the possibilities:
| Total Number of Points | Number of 2-Point Baskets | Number of 3-Point Baskets |
| 17 | 7 (14 points) | 1 (3 points) |
| 17 | 4 (8 points) | 3 (9 points) |
| 17 | 1 (2 points) | 5 (15 points) |
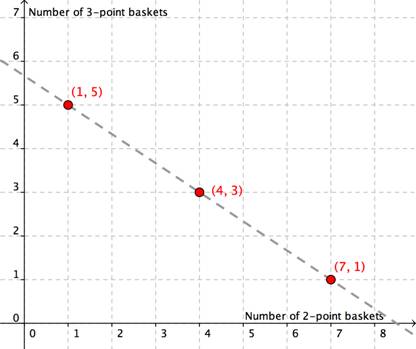
So, for the first relationship, there are three possible solutions. Cheryl could have scored 17 points with any of the basket combinations above. Here’s a graph that shows those possible solutions to the first relationship:
Now let’s consider the second relationship. The number of 2-point baskets is one greater than the number of 3-point baskets that she scored. We can make a table to represent this information, too.
| Number of 2-Point Baskets | Number of 3-Point Baskets |
| 1 | 0 |
| 2 | 1 |
| 3 | 2 |
| 4 | 3 |
| 5 | 4 |
| … | … |
Notice that this relationship could keep going for many more values because the equation does not place any limit on how many baskets of either type she scored.
Since the variables in this relationship are the same as the ones in the first relationship, we can plot these solutions on the same axes:
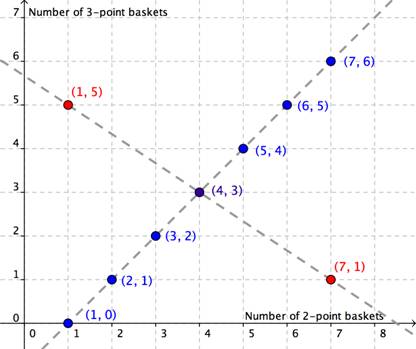
So what do we see? We have two axes, one labeled “Number of 2-point baskets” and one labeled “Number of 3-point baskets,” and we have plotted both relationships along these axes. There is only one point that lies on the graphs of both, only one point that is true for both equations. That point is (4, 3), and it is the answer to the system: Cheryl scored 4 2-point baskets and 3 3-point baskets.
Which of the following scenarios can only be solved by using a system of equations?
A) Paco and Lisel spent $30 going to the movies last night. Tonight, they spent another $10 at dinner. How much did they spend total?
B) Paco and Lisel spent $30 going to the movies last night. They had $8 left over afterwards. How much did they have before the movie?
C) Paco and Lisel spent $30 going to the movies last night. Each ticket cost $9. How much did they spend on soda and popcorn?
D) Paco and Lisel spent $30 going to the movies last night. Paco spent $8 more than Lisel. How much did each of them spend?
Summary
Systems of equations are comprised of two or more equations that share two or more unknowns. We can graph the equations within a system to find out whether the system has zero solutions (represented by parallel lines), one solution (represented by intersecting lines), or an infinite number of solutions (represented by two superimposed lines). While graphing systems of equations is a useful technique, relying on graphs to identify a specific point of intersection is not always an accurate way to find a precise solution for a system of equations.
