Representing Functions and Relations
Learning Objective(s)
· Define, compare, and recognize relations and functions.
· Represent relations and functions with graphs, tables, and sets of ordered pairs.
Introduction
Algebra is a potent tool for describing and exploring relationships.
Imagine tossing a ball straight up into the air, watching it rise, stop, and fall back down into your hand. As time passed, the height of the ball changed, creating a relationship between the amount of time the ball was in the air and its height.
In mathematics, a relationship between variables that change together (such as time and height) is called a relation.
There are many kinds of relations. Among the most important algebraic relations are functions. A function is a relation in which one variable specifies a single value of another variable. For example, when you toss a ball, each second that passes has one and only one corresponding height. Time only goes forward, and never repeats itself. The height of the ball depends on how much time has passed since it left your hand. This is a one way relationship—although each moment of time is unique, it is possible for the ball to be at a particular height more than once as it goes up and then down. Knowing the time will tell you the height, but knowing the height won’t give you an exact time.
The parts of a function are called inputs and outputs. An input is the independent, non-repeating quantity. The output quantity is the dependent quantity. The value of the output depends on the value of the input. For each input, there is a single output. In the case of tossing a ball in the air, time is the input and height is the output.
Let’s look at a few more examples to get comfortable recognizing what is a function and what is not. Remember the last time you were in a parking lot? You won’t be surprised to know that there’s a relation between the number of cars and the number of tires in a lot—the number of cars and the number of tires are linked. Is this relation a function? Can you use the number of cars to correctly figure out the number of tires?
Yes, you can. Every single car has 4 tires, so the number of tires depends on how many cars are in the parking lot. Every input of cars specifies a single possible output of tires. (In this example, the relation of tires to cars is also a function—the number of tires also specifies the number of cars.)
Now consider a different relation, between houses and the people who live in them. If an address is the input, and the output is the occupants, is this relation also a function? Think of your own house or apartment—are the people staying there always the same?
Nope. That time you went to camp, the occupancy changed. Every time you had a friend stay over, it changed again. Because a single address can produce more than one set of occupants, the relation is not a function.
Here’s a good rule of thumb to use to recognize functions: If you put the input in more than once, are you guaranteed to always get the same output? With the cars and wheels, the answer is yes. For an input of 25 cars we always get an output of 100 tires, no matter which 25 cars drive into that parking lot or when they arrive. The relation is a function.
With the houses and occupants, the input of an address is not guaranteed to always produce the same output, because a house stays put while people come and go. The relation is not a function.
Which of the following situations describes a function?
A) Your age and your weight on your birthday each year.
B) The name of a course and the number of students enrolled in that course.
C) The diameter of a cookie and the number of chocolate chips in it.
When both the independent quantity (input) and the dependent quantity (output) are real numbers, a function can be represented by a coordinate graph. The independent value is plotted on the x-axis and the dependent value is plotted on the y-axis. The fact that each input value has exactly one output value means graphs of functions have certain characteristics. For each input (x-coordinate) on the graph, there will be exactly one output (y-coordinate).
For example, the graph of this function, drawn in blue, looks like a semi-circle. We know that y is a function of x because for each x-coordinate there is exactly one y-coordinate.
If we draw a vertical line across the plot of the function, it only intersects the function once for each value of x. That is true no matter where the line is drawn. Placing or sliding such a line across a graph is a good way to determine if it shows a function.
Compare that graph with this one, which looks like a blue circle. This relationship cannot be a function, because each x-coordinate has two corresponding y-coordinates.
When a vertical line is placed across the plot of this relation, it intersects the graph more than once for some values of x. If a graph shows two or more intersections with a vertical line, then an input (x-coordinate) can have more than one output (y-coordinate), and y is not a function of x.
Functions in Table Form
Tables can also be used to describe functions. Let’s compare tables of functions with tables of non-functions.
This table represents a function. None of the independent values (x) are repeated and each has only one corresponding dependent value (y).
| x | y |
| -1 | 3 |
| -2 | 5 |
| -3 | 3 |
| -5 | -3 |
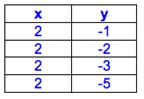
The next table does not represent a function. The x column has two values that are 3, and they correspond to two different values for y. Remember, when a single input can produce multiple outputs, the relation is not a function.
| x | y |
| 3 | -1 |
| 5 | -2 |
| 3 | -3 |
| -3 | -5 |
Functions as Sets of Ordered Pairs
Functions can also be represented by sets of ordered pairs of x and y values, inputs and outputs. We can pull pairs from tables or graphs, and use parentheses to keep them together.
Let’s go back to this table of a function:
| x | y |
| -1 | 3 |
| -2 | 5 |
| -3 | 3 |
| -5 | -3 |
Each row in the table describes an ordered pair, like this: an x of -1 corresponds to a y of 3, so that’s the ordered pair (-1, 3). An x of -2 corresponds to a y of 5, so that’s the ordered pair (-2, 5). The whole table gives us a set of ordered pairs:
{(-1, 3), (-2, 5), (-3, 3), (-5, -3)}
To show that the four ordered pairs belong together in a set, we list them with commas in between each and brackets around the group. As with other methods of representing relations, we can check the characteristics of a set of ordered pairs to determine if it is a function. Since the first value in each pair is the input and the second is the output, we can scan the set to see if each input is associated with a single, consistent output. If it is, the set is a function.
Or we can plot the points on a coordinate grid, for a visual check. Here, we can see that in the set of pairs we just listed, every x/input/independent value has one and only one y/output/dependent value:
In another set of ordered pairs: {(3,-1),(5,-2),(3,-3),(-3,5)} one of the inputs, 3, can produce two different outputs, -1 and -3. You know what that means—this set of ordered pairs is not a function. A plot confirms this:
Notice that a vertical line passes through two plotted points. One x-coordinate has multiple y-coordinates. That too means that this relation is not a function.
Which of the following is a set of ordered pairs representing a function?
A) {2, 4, 4, 8, 8,16, 16, 32}
B) {(0, 0), (1, 1), (1, -1), (2, 2), (2, -2)}
C) (4, 2), (5, 1), (6, 0), (7, -1), (8, -2)
D) {(-2, 2), (-1, 1), (0, 0), (1, 1), (2, 2)}
Horizontal and Vertical Lines—Functions or Not?
Two special types of relations are those of horizontal and vertical lines. Are they functions?
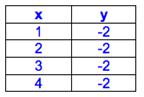
Let’s begin with a horizontal line. A line on the coordinate plane is horizontal when every x-coordinate has the same y-coordinate. No x-coordinates have more than one y-coordinate, and each input always produces the same output. Therefore, all horizontal lines represent a function.
Now consider a vertical line. In this situation, every y-coordinate has the same x-coordinate. The input never changes, but the output changes constantly. Since the same value for x has many values for y, a vertical line cannot represent a function.
Summary
In real life and in algebra, different variables are often linked. When variables change together, their interaction is called a relation. When one variable determines the exact value of a second variable, their relation is called a function. Functions can be recognized, described, and examined in a variety of ways, including graphs, tables, and sets of ordered pairs.
