
Looking for Patterns
The main business of science is to uncover patterns in nature. Mathematics is a tool that is of great importance to scientists as they complete this task.
Task
In this project you play the part of an amateur scientist seeking to uncover patterns in various physical situations. You will collect and analyze some data using your knowledge of scientific notation and arithmetic involving monomials and binomials.
Instructions
Work with at least one other person to complete the following exercises. Solve each problem in order and save your work along the way, as you will create a presentation on one of the four parts to be given to your class.
· First Problem – Data Collection: In this experiment, you will examine the relationship between the length of a pendulum arm and the amount of time it takes for the pendulum to swing back and forth. To complete this, you will need some string, tape, a stopwatch or some other timing device, and a large metal washer or heavy ring. [Note: We did not own a stopwatch, so we used the online stopwatch at http://www.online-stopwatch.com.]
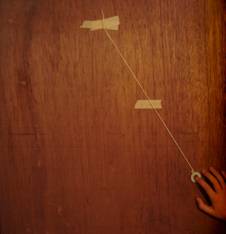
o Tie the washer or ring onto one end of the string and tape the top of the string to a wall. Then, choose an initial angle from which to let the ring go and mark that with an “X”. See the Figure 1 below.
|
|
|
Figure 1: This figure shows the string taped to the wall at the top with a washer attached to the end. The other piece of tape has a red X on it marking the angle at which we will release the pendulum each time. It should be high enough so that it will work for the short, medium, and long pieces of string. |
o You will vary the length of string in this experiment, and for each length, you will measure the period, or the length of time it takes for the pendulum to complete one back and forth motion. If you try this once, you will notice that it is difficult to measure one period since the pendulum moves so quickly. To help us, we will time how long it takes for the pendulum to complete five (5) cycles and then divide this total time by five to get the period.
o Choose a “long” length of string (for the next two parts, you will cut this string to make it shorter), and write that length in the space provided above the charge below. Measure the period 12 times, cross out the high and the low and calculate the average of the numbers that are left.
|
Trial #1: LONG STRING |
||||||||||||||
|
Length of String = ___________ cm |
|
Average Period = ___________ seconds |
||||||||||||
|
Trial No. |
1 |
2 |
3 |
4 |
5 |
6 |
7 |
8 |
9 |
10 |
11 |
12 |
||
|
Time of 1 Period |
|
|
|
|
|
|
|
|
|
|
|
|
||
o Cut your string so that it is now a “medium” length, and write that length in the space provided above the charge below. Measure the period 12 times, cross out the high and the low and calculate the average of the numbers that are left.
|
Trial #2: MEDIUM STRING |
||||||||||||||
|
Length of String = ____________ cm |
|
Average Period = ___________ seconds |
||||||||||||
|
Trial No. |
1 |
2 |
3 |
4 |
5 |
6 |
7 |
8 |
9 |
10 |
11 |
12 |
||
|
Time of 1 Period |
|
|
|
|
|
|
|
|
|
|
|
|
||
o Finally, cut the string so that it is “short,” and write that length in the space provided above the charge below. Measure the period 12 times, cross out the high and the low and calculate the average of the numbers that are left.
|
Trial #3: SHORT STRING |
||||||||||||||
|
Length of String = ____________ cm |
|
Average Period = ___________ seconds |
||||||||||||
|
Trial No. |
1 |
2 |
3 |
4 |
5 |
6 |
7 |
8 |
9 |
10 |
11 |
12 |
||
|
Time of 1 Period |
|
|
|
|
|
|
|
|
|
|
|
|
||
· Second Problem – Finding the Pattern: We will now try to find a pattern in this data.
o As with many events in physics, the dividing two quantities in this case should give a constant. Complete the chart below to determine the pattern in this case. Circle the relationship in the top row of the table that shows the pattern. Round your answers to the nearest hundredths.
|
|
Period (in seconds)
|
Length of String (in cm)
|
|
|
|
|
Trial #1 |
|
|
|
|
|
|
Trial #2 |
|
|
|
|
|
|
Trial #3 |
|
|
|
|
|
o There are many other situations in which this type of pattern arises. One of the most famous comes from an astronomer named Johannes Kepler. He carefully studied astronomical data collected without the aid of a telescope by Tyco Brahe and noticed several patterns, which are today called “Kepler’s Three Laws of Planetary Motion.”
|
Johannes Kepler |
Tyco Brahe |
|
|
|
|
1571-1630 |
1546-1601 |


The table below records
data on the period of some planets in our solar system as well as their average
distance from the center of the Sun. Convert each of the numbers into
scientific notation. Since the numbers are large, this will make our
calculations easier. Remember to round each of your numbers to three
significant digits (that is, round a number such as ![]() to
to ![]() ).
).
|
|
Period (in days) |
Period in Scientific Notation |
Distance from Sun (in meters) |
Distance from Sun in Scientific Notation |
|
Mercury |
88.00 |
|
58,000,000,000 |
|
|
Venus |
224.70 |
|
108,000,000,000 |
|
|
Earth |
365.25 |
|
149,000,000,000 |
|
|
Jupiter |
4331.86 |
|
778,000,000,000 |
|
|
Neptune |
60,193.20 |
|
4,490,000,000,000 |
|
o Finally, complete the chart below to determine the pattern in this case. Circle the relationship in the top row of the table that shows the pattern.
|
|
Period (in days)
|
Distance from Sun (in meters)
|
|
|
|
|
Mercury |
|
|
|
|
|
|
Venus |
|
|
|
|
|
|
Earth |
|
|
|
|
|
|
Jupiter |
|
|
|
|
|
|
Neptune |
|
|
|
|
|
·
Third Problem
– Finding Units:
One very important task of the scientist is to keep track of units. This helps
catch arithmetic errors and gives the proper meaning to different quantities.
For example, if we were to calculate the speed of an object, we could divide
the distance traveled (in miles) by the time elapsed (in hours) to get ![]() , or simply “miles per hour.”
, or simply “miles per hour.”
Here, we ask you to calculate the units of the constants you computed above as well as some other famous constants from science. Do not be thrown off that some of these constants have long names or that the units are unfamiliar to you. In the end, you are just performing algebra with letters that have exponents on them!
o Use this method to determine the units on the constant you computed for the pendulum.
o Use this method to determine the units on the constant you computed Kepler’s Law. Use d to stand for “days” and m to stand for “meters.”
o Finally, we will introduce you to some other famous constants and ask you to determine the units on them:
o
In the study of
fluid flow through a tube (such as blood flow through an artery), Poisueille’s
Law describes the relationship between the flow rate Q of a fluid (with units ![]() ), the radius R of the tube (with
units
), the radius R of the tube (with
units ![]() ),
the length of the tube (with units
),
the length of the tube (with units ![]() ), and the
pressure P of the fluid in the tube (with units
), and the
pressure P of the fluid in the tube (with units ![]() ). This law states that the
following quantity will be constant:
). This law states that the
following quantity will be constant: ![]() . Calculate
the units on this constant (which is known as Dynamic Viscosity).
. Calculate
the units on this constant (which is known as Dynamic Viscosity).
o
In geology,
Darcy’s Law describes the relationship between the flow rate Q of fluid through
porous rock (with units ![]() ), the cross-sectional area of the
rock A (with units
), the cross-sectional area of the
rock A (with units ![]() ),
the pressure on the fluid P (with units
),
the pressure on the fluid P (with units ![]() ), the
length that the fluid must flow L (with units
), the
length that the fluid must flow L (with units ![]() ), and the
thickness (viscosity) of the fluid u (with units
), and the
thickness (viscosity) of the fluid u (with units ![]() ). This law
states that the following quantity will be constant:
). This law
states that the following quantity will be constant: ![]() . Calculate
the units on this constant (which is known as the Permeability of the Rock).
. Calculate
the units on this constant (which is known as the Permeability of the Rock).
o
In chemistry,
the Ideal Gas Law describes a gas in a closed container with pressure P (with
units ![]() ), volume V (with units
), volume V (with units ![]() ), amount of
gas n (with units
), amount of
gas n (with units ![]() ), and temperature T (with units
), and temperature T (with units ![]() ).*
This law states that the following quantity will be constant for any gas in a
closed container:
).*
This law states that the following quantity will be constant for any gas in a
closed container: ![]() . Calculate the units on this
constant (which is known as the Ideal Gas Constant). [Hint: even
though the unit
. Calculate the units on this
constant (which is known as the Ideal Gas Constant). [Hint: even
though the unit ![]() has 3 letters in it, you treat it
just as if it were one whole letter.]
has 3 letters in it, you treat it
just as if it were one whole letter.]
·
Fourth
Problem – Long-Term Patterns: One very different kind of pattern involves two polynomials
that are divided. Such expressions are difficult to deal with and so many
scientists prefer to approximate them with simpler expressions, especially for
large values of x. Below are three such expressions. For each: (1) use
long division to rewrite the expression as ![]() , (2) complete the chart, and (3) write an expression which
approximates the original for large values of x. [Hint: To help you
see the patterns, we suggest that you keep as many decimal places as possible
in your answers.]
, (2) complete the chart, and (3) write an expression which
approximates the original for large values of x. [Hint: To help you
see the patterns, we suggest that you keep as many decimal places as possible
in your answers.]
|
Expression #1 |
|||
|
Expression:
|
Rewritten: |
||
|
Value of x |
Value of expression |
Value of quotient |
Value of
|
|
10 |
|
|
|
|
20 |
|
|
|
|
50 |
|
|
|
|
100 |
|
|
|
|
1,000 |
|
|
|
|
Expression #2 |
|||
|
Expression:
|
Rewritten: |
||
|
Value of x |
Value of expression |
Value of quotient |
Value of
|
|
10 |
|
|
|
|
20 |
|
|
|
|
50 |
|
|
|
|
100 |
|
|
|
|
1,000 |
|
|
|
|
Expression #3 |
|||
|
Expression:
|
Rewritten: |
||
|
Value of x |
Value of expression |
Value of quotient |
Value of
|
|
10 |
|
|
|
|
20 |
|
|
|
|
50 |
|
|
|
|
100 |
|
|
|
|
1,000 |
|
|
|
Collaboration
Get together with another group to compare your answers to each of the four problems. Discuss any differences in your answers and come to conclusions everyone agrees upon.
Conclusions
Lastly, prepare your final presentation for the part assigned to you by your instructor. Be sure to clearly explain your reasoning at each stage. Then, present your solution to the class.
Grade
Your project should correctly identify and justify mathematically: (1) the pattern in the data collected from the pendulum experiment, (2) the pattern in the planetary data, (3) the units for each of the constants given in the third question, (4) the re-written form for each of the three expressions in the fourth question, and (5) the approximation for each of the expressions in the fourth question.
|
Score |
Content |
Presentation/Communication |
|
4 |
• The solution shows a deep understanding of the problem including the ability to identify the appropriate mathematical concepts and the information necessary for its solution. • The solution completely addresses all mathematical components presented in the task. • The solution puts to use the underlying mathematical concepts upon which the task is designed and applies procedures accurately to correctly solve the problem and verify the results. • Mathematically relevant observations and/or connections are made. |
• There is a clear, effective explanation detailing how the problem is solved. All of the steps are included so that the reader does not need to infer how and why decisions were made. • Mathematical representation is actively used as a means of communicating ideas related to the solution of the problem. • There is precise and appropriate use of mathematical terminology and notation. • Your project is professional looking with graphics and effective use of color. |
|
3 |
• The solution shows that the student has a broad understanding of the problem and the major concepts necessary for its solution. • The solution addresses all of the mathematical components presented in the task. • The student uses a strategy that includes mathematical procedures and some mathematical reasoning that leads to a solution of the problem. • Most parts of the project are correct with only minor mathematical errors. |
• There is a clear explanation. • There is appropriate use of accurate mathematical representation. • There is effective use of mathematical terminology and notation. • Your project is neat with graphics and effective use of color. |
|
2 |
• The solution is not complete indicating that parts of the problem are not understood. • The solution addresses some, but not all of the mathematical components presented in the task. • The student uses a strategy that is partially useful, and demonstrates some evidence of mathematical reasoning. • Some parts of the project may be correct, but major errors are noted and the student could not completely carry out mathematical procedures. |
• Your project is hard to follow because the material is presented in a manner that jumps around between unconnected topics. • There is some use of appropriate mathematical representation. • There is some use of mathematical terminology and notation appropriate for the problem. • Your project contains low quality graphics and colors that do not add interest to the project. |
|
1 |
• There is no solution, or the solution has no relationship to the task. • No evidence of a strategy, procedure, or mathematical reasoning and/or uses a strategy that does not help solve the problem. • The solution addresses none of the mathematical components presented in the task. • There were so many errors in mathematical procedures that the problem could not be solved. |
• There is no explanation of the solution, the explanation cannot be understood or it is unrelated to the problem. • There is no use, or inappropriate use, of mathematical representations (e.g. figures, diagrams, graphs, tables, etc.). • There is no use, or mostly inappropriate use, of mathematical terminology and notation. • Your project is missing graphics and uses little to no color. |
 Some rights reserved