Identifying Functions
Learning Objective(s)
· Determine whether a relation is a function.
· Determine the domain of a function and the range of a function.
· Determine whether a graph is that of a function by using a vertical line test.
Introduction
Algebra gives us a way to explore and describe relationships. Imagine tossing a ball straight up in the air and watching it rise to reach its highest point before dropping back down into your hands. As time passes, the height of the ball changes. There is a relationship between the amount of time that has elapsed since the toss and the height of the ball. In mathematics, a correspondence between variables that change together (such as time and height) is called a relation. Some, but not all, relations can also be described as functions.
There are many kinds of relations. Relations are simply correspondences between sets of values or information. Think about members of your family and their ages. The pairing of each member of your family and their age is a relation. Each family member can be paired with an age in the set of ages of your family members. Another example of a relation is the pairing of a state with its United States’ senators. Each state can be matched with two individuals who have been elected to serve as senator. In turn, each senator can be matched with one specific state that he or she represents. Both of these are real-life examples of relations.
The first value of a relation is an input value and the second value is the output value. A function is a specific type of relation in which each input value has one and only one output value. An input is the independent value, and the output value is the dependent value, as it depends on the value of the input.
Notice in the first table below, where the input is “name” and the output is “age”, each input matches with exactly one output. This is an example of a function.
| (Input) Family Member’s name | (Output) Family Member’s Age |
| Nellie | 13 |
| Marcos | 11 |
| Esther | 46 |
| Samuel | 47 |
| Nina | 47 |
| Paul | 47 |
| Katrina | 21 |
| Andrew | 16 |
| Maria | 13 |
| Ana | 81 |
Compare this with the next table, where the input is “age” and the output is “name.” Some of the inputs result in more than one output. This is an example of a correspondence that is not a function.
| Starting Information (Input) Family Member’s Age | Related Information (Output) Family Member’s Name |
| 11 | Marcos |
| 13 | Nellie Maria |
| 16 | Andrew |
| 21 | Katrina |
| 46 | Esther |
| 47 | Samuel Nina Paul |
| 81 | Ana |
Let’s look back at our examples to determine whether the relations are functions or not and under what circumstances. Remember that a relation is a function if there is only one output for each input.
| Input | Output | Function? | Why or why not? |
| Name of senator | Name of state | Yes | For each input, there will only be one output because a senator only represents one state. |
| Name of state | Name of senator | No | For each state that is an input, 2 names of senators would result because each state has two senators. |
| Time elapsed | Height of a tossed ball | Yes | At a specific time, the ball has one specific height. |
| Height of a tossed ball | Time elapsed | No | Remember that the ball was tossed up and fell down. So for a given height, there could be two different times when the ball was at that height. The input height can result in more than one output. |
| Number of cars | Number of tires | Yes | For any input of a specific number of cars, there is one specific output representing the number of tires. |
| Number of tires | Number of cars | Yes | For any input of a specific number of tires, there is one specific output representing the number of cars. |
| Which of the following situations describes a function?
A) Your age and your weight at noon on your birthday each year. B) The number of people on a professional baseball team and the name of the team. C) The diameter of a cookie and the number of chocolate chips in it.
|
Relations can be written as ordered pairs of numbers or as numbers in a table of values. By examining the inputs (x-coordinates) and outputs (y-coordinates), you can determine whether or not the relation is a function. Remember, in a function each input has only one output. A couple of examples follow.
| Example | ||||||||||||||
| Problem | Is the relation given by the set of ordered pairs below a function? {(−3, −6),(−2, −1),(1, 0),(1, 5),(2, 0)} | |||||||||||||
|
|
| Organizing the ordered pairs in a table can help. By definition, the inputs in a function have only one output.
The input 1 has two outputs: 0 and 5. | ||||||||||||
| Answer | The relation is not a function. |
| ||||||||||||
| Example | ||||||||||||||
| Problem | Is the relation given by the set of ordered pairs below a function? {(−3, 4),(−2, 4),( −1, 4),(2, 4),(3, 4)} | |||||||||||||
|
|
| You could reorganize the information by creating a table. | ||||||||||||
|
| Each input has only one output. | Each input has only one output, and the fact that it is the same output (4) does not matter. | ||||||||||||
| Answer | This relation is a function. |
| ||||||||||||
Remember that in a function, the input value must have one and only one value for the output.
There is a name for the set of input values and another name for the set of output values for a function. The set of input values is called the domain of the function. And the set of output values is called the range of the function.
If you have a set of ordered pairs, you can find the domain by listing all of the input values, which are the x-coordinates. And to find the range, list all of the output values, which are the y-coordinates.
So for the following set of ordered pairs,
{(−2, 0), (0, 6), (2, 12), (4, 18)}
You have the following:
Domain: {−2, 0, 2, 4}
Range: {0, 6, 12, 18}
| Jamie plans to sell homemade pies for $10 each at a local farm stand. The amount of money he makes is a function of how many pies he sells: $0 if he sells 0 pies, $10 if he sells 1 pie, $20 if he sells 2 pies, and so on. He does not want the pies to spoil before he is able to sell them, so he will not make (or sell) more than 9 pies. What is the domain and range for that function?
A) Domain: {0, 10, 20, 30, 40, 50, 60, 70, 80, 90} Range: {0, 1, 2, 3, 4, 5, 6, 7, 8, 9} B) Domain: {0, 1, 2, 3, 4, 5, 6, 7, 8, 9} Range: {0, 10, 20, 30, 40, 50, 60, 70, 80, 90} C) Domain: {0, 1, 2} Range: {0, 10, 20} D) Domain: all numbers greater than or equal to 0
|
| Example | |||
| Problem | State the domain and range of the following function. {(−3, 5), (−2, 5), (−1, 5), (0, 5), (1, 5), (2, 5)} |
| |
|
| {−3,−2,−1,0,1,2} | The domain is all the x-coordinates. | |
|
| {5} | The range is all the y-coordinates. Each ordered pair has the same y-coordinate. It only needs to be listed once. | |
| Answer | Domain: {−3,−2,−1,0,1,2} Range: {5} |
| |
| Example | ||||||||||||||||
| Problem | Find the domain and range for the function.
|
| ||||||||||||||
|
| {−5, −2, −1, 0, 5} | The domain is the set of inputs or x-coordinates. | ||||||||||||||
|
| {−6, −1, 0, 3, 15} | The range is the set of outputs of y-coordinates. | ||||||||||||||
| Answer | Domain: {−5, −2, −1, 0, 5} Range: {−6, −1, 0, 3, 15} |
| ||||||||||||||
When both the independent quantity (input) and the dependent quantity (output) are real numbers, a function can be represented by a graph in the coordinate plane. The independent value is plotted on the x-axis and the dependent value is plotted on the y-axis. The fact that each input value has exactly one output value means graphs of functions have certain characteristics. For each input on the graph, there will be exactly one output.
For example, the graph of the function below drawn in blue looks like a semi-circle. You know that y is a function of x because for each x-coordinate there is exactly one y-coordinate.
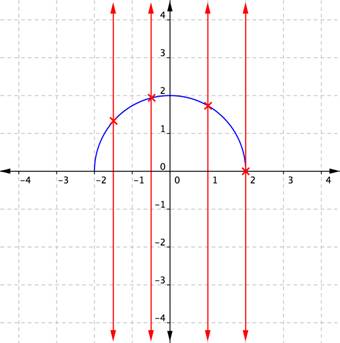
If you draw a vertical line across the plot of the function, it only intersects the function once for each value of x. That is true no matter where the vertical line is drawn. Placing or sliding such a line across a graph is a good way to determine if it shows a function.
Compare the previous graph with this one, which looks like a blue circle. This relationship cannot be a function, because some of the x-coordinates have two corresponding y-coordinates.
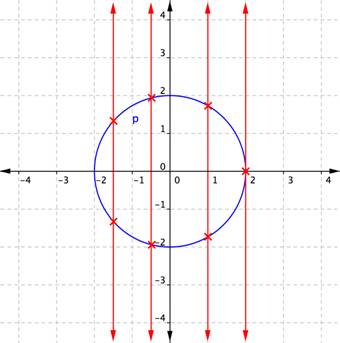
When a vertical line is placed across the plot of this relation, it intersects the graph more than once for some values of x. If a graph shows two or more intersections with a vertical line, then an input (x-coordinate) can have more than one output (y-coordinate), and y is not a function of x. Examining the graph of a relation to determine if a vertical line would intersect with more than one point is a quick way to determine if the relation shown by the graph is a function. This method is often called the “vertical line test.”
The vertical line method can also be applied to a set of ordered pairs plotted on a coordinate plane to determine if the relation is a function. Consider the ordered pairs
{(−1, 3),(−2, 5),(−3, 3),(−5, −3)}, plotted on the graph below.
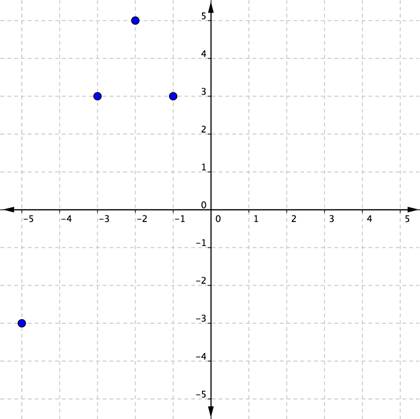
Here, you can see that in the set of pairs just listed, every independent value has one and only one dependent value. You can also check that a vertical line running through any point would not intersect with another point. A horizontal line would intersect two of the points, but that is just fine. (Remember, it’s a vertical line test not a horizontal line test that determines if a relation is a function!)
In another set of ordered pairs, {(3, −1),(5, −2),(3, −3),(−3, 5)}, one of the inputs, 3, can produce two different outputs, −1 and −3. You know what that means—this set of ordered pairs is not a function. A plot confirms this.
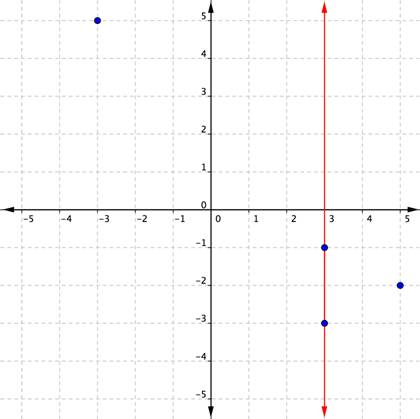
Notice that a vertical line passes through two plotted points. One x-coordinate has multiple y-coordinates. This relation is not a function.
| Which of the following is a set of ordered pairs representing a function?
A) {2, 4, 4, 8, 8, 16, 16, 32} B) {(0, 0), (1, 1), (1, −1), (2, 2), (2, −2)} C) {(5, −10), (5, −3), (5, 0), (5, 2), (5, 17)} D) {(−2, 2), (−1, 1), (0, 0), (1, 1), (2, 2)}
|
Summary
In real life and in Algebra, different variables are often linked. When a change in value of one variable causes a change in the value of another variable, their interaction is called a relation. A relation has an input value which corresponds to an output value. When each input value has one and only one output value, that relation is a function. Functions can be written as ordered pairs, tables, or graphs. The set of input values is called the domain, and the set of output values is called the range.
