Graphing Systems of Inequalities
Learning Objective(s)
· Solve a system of linear inequalities by graphing.
· Determine whether an ordered pair is a solution of a system of inequalities.
· Solve application problems by graphing a system of inequalities.
Introduction
A solution of a system of linear equalities is any ordered pair that is true for all of the equations in the system. Likewise, a solution of a system of linear inequalities is any ordered pair that is a solution for all of the inequalities in the system.
Graphs are used to show all of the values that are solutions for a system of linear inequalities.
The graph of a single linear inequality splits the coordinate plane into two regions. On one side lie all the solutions to the inequality. On the other side, there are no solutions. Consider the graph of the inequality y < 2x + 5.

The dashed line is y = 2x + 5. Every ordered pair in the colored area below the line is a solution to y < 2x + 5, as all of the points below the line will make the inequality true. If you doubt that, try substituting the x and y coordinates of Points A and B into the inequality—you’ll see that they work. So, the shaded area shows all of the solutions for this inequality.
The boundary line divides the plane into two half planes. In this case, it is shown as a dashed line as the points on the line don’t satisfy the inequality. If the inequality had been y ≤ 2x + 5, then the boundary line would have been solid.
Let’s graph another inequality: y > −x. You can check a couple of points to determine which side of the boundary line to shade. Checking points M and N yield true statements. So, we shade the area above the line. The line is dashed as points on the line are not true.
To create a system of inequalities, you need to graph two or more inequalities together. Let’s use y < 2x + 5 and y > −x since we have already graphed each of them.
The purple area shows where the solutions of the two inequalities overlap. This area is the solution to the system of inequalities. Any point within this purple region will be true for both y > −x and y < 2x + 5.
On the graph, you can see that the points B and N are solutions for the system because their coordinates will make both inequalities true statements.
In contrast, points M and A both lie outside the solution region (purple). While point M is a solution for the inequality y > −x and point A is a solution for the inequality y < 2x + 5, neither point is a solution for the system.
| Example | |||
| Problem | Is the point (2, 1) a solution of the system x + y > 1 and 2x + y < 8? | ||
|
| x + y > 1 2 + 1 > 1 3 > 1
TRUE (2, 1) is a solution for x + y > 1. | 2x + y < 8 2(2) + 1 < 8 4 + 1 < 8 5 < 8
TRUE (2, 1) is a solution for 2x + y < 8. | Check the point with each of the inequalities. Substitute 2 for x and 1 for y. Is the point a solution of both inequalities?
|
| Answer | The point (2, 1) is a solution of the system x + y > 1 and 2x + y < 8. | Since (2, 1) is a solution of each inequality, it is also a solution of the system. | |
Here is a graph of the system in the example above. Notice that (2, 1) lies in the purple area, which is the overlapping area for the two inequalities.
| Example | |||
| Problem | Is the point (2, 1) a solution of the system x + y > 1 and 3x + y < 4? | ||
|
| x + y > 1 2 + 1 > 1 3 > 1
TRUE (2, 1) is a solution for x + y > 1. | 3x + y < 4 3(2) + 1 < 4 6 + 1 < 4 7 < 4
FALSE (2, 1) is not a solution for 3x + y < 4. | Check the point with each of the inequalities. Substitute 2 for x and 1 for y. Is the point a solution of both inequalities?
|
| Answer | The point (2, 1) is not a solution of the systemx + y > 1 and 3x + y < 4. | Since (2, 1) is not a solution of one of the inequalities, it is not a solution of the system. | |
Here is a graph of this system. Notice that (2, 1) is not in the purple area, which is the overlapping area; it is a solution for one inequality (the red region), but it is not a solution for the second inequality (the blue region).
| Which of the points listed below are solutions for the system? y > x x − 2 < 0
I. (1, 1) II. (−5, 9) III. (0, 7)
A) I and II
B) II and III
C) I and III
D) II only
|
As shown above, finding the solutions of a system of inequalities can be done by graphing each inequality and identifying the region they share.
| Example | |||
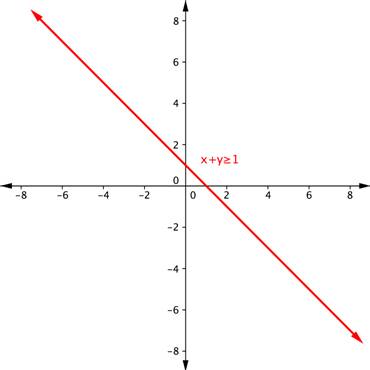
| Problem | Find the solution to the system x + y ≥ 1 and y – x ≥ 5. | ||
|
| Graph one inequality. First graph the boundary line, using a table of values, intercepts, or any other method you prefer. The boundary line for x + y ≥ 1 is x + y = 1, or y = −x + 1. Since the equal sign is included with the greater than sign, the boundary line is solid. | ||
|
| Test 1: (−3, 0) x + y ≥ 1 −3 + 0 ≥ 1 −3 ≥ 1
FALSE
| Test 2: (4, 1) x + y ≥ 1 4 + 1 ≥ 1 5 ≥ 1
TRUE | Find an ordered pair on either side of the boundary line. Insert the x- and y-values into the inequality x + y ≥ 1 and see which ordered pair results in a true statement. |
|
|
Since (4, 1) results in a true statement, the region that includes (4, 1) should be shaded.
| ||
|
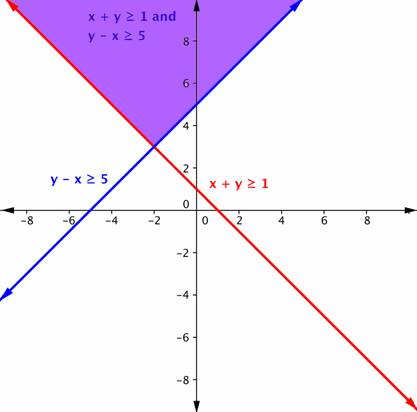
| Do the same with the second inequality. Graph the boundary line, then test points to find which region is the solution to the inequality. In this case, the boundary line is y – x = 5 (or y = x + 5) and is solid. Test point (−3, 0) is not a solution of y – x ≥ 5, and test point (0, 6) is a solution. | ||
| Answer | The purple region in this graph shows the set of all solutions of the system.
| ||
| Example | ||
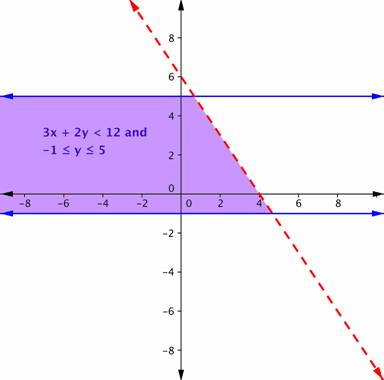
| Problem | Find the solution to the system 3x + 2y < 12 and −1 ≤ y ≤ 5. | |
|
|
Graph one inequality. First graph the boundary line, then test points.
Remember, because the inequality 3x + 2y < 12 does not include the equal sign, draw a dashed border line.
Testing a point (like (0, 0) will show that the area below the line is the solution to this inequality. | |
|
|
The inequality −1 ≤ y ≤ 5 is actually two inequalities: −1 ≤ y, and y ≤ 5. Another way to think of this is y must be between −1 and 5. The border lines for both are horizontal. The region between those two lines contains the solutions of −1 ≤ y ≤ 5. We make the lines solid because we also want to include y = −1 and y = 5.
Graph this region on the same axes as the other inequality. | |
| Answer | The purple region in this graph shows the set of all solutions of the system.
| |
| In which of the following is the purple region the solution for the system? y > x y < −3x+ 6
A)
B)
C)
D)
|


Graphing a system of inequalities can help you solve real-life situations.
| Example | ||
| Problem | Cathy is selling ice cream cones at a school fundraiser. She is selling two sizes: small (which has 1 scoop) and large (which has 2 scoops). She knows that she can get a maximum of 70 scoops of ice cream out of her supply. She charges $3 for a small cone and $5 for a large cone.
Cathy wants to earn at least $120 to give back to the school. Write and graph a system of inequalities that models this situation. | |
|
| s = small cone l = large cone | First, identify the variables. There are two variables: the number of small cones and the number of large cones. |
|
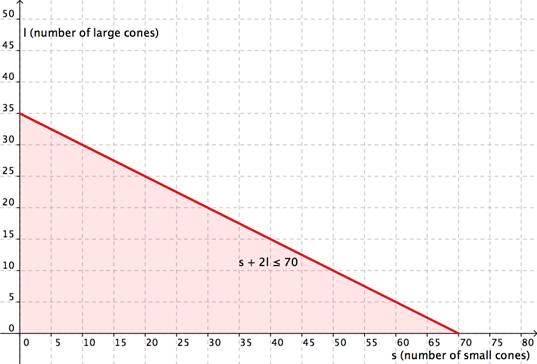
| s + 2l ≤ 70 | Write the first equation: the maximum number of scoops she can give out. The scoops she has available (70) must be greater than or equal to the number of scoops for the small cones (s) and the large cones (2l) she sells. |
|
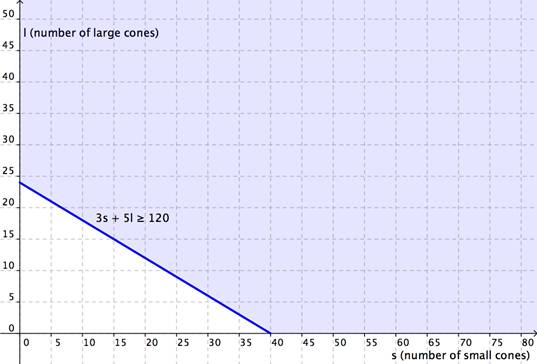
| 3s + 5l ≥ 120 | Write the second equation: the amount of money she raises. She wants the total amount of money earned from small cones (3s) and large cones (5l) to be at least $120. |
|
| s + 2l ≤ 70 3s + 5l ≥ 120 | Write the system. |
|
| Now graph the system. The variables x and y have been replaced by s and l; graph s along the x-axis, and l along the y-axis.
First graph the region s + 2l ≤ 70. Graph the boundary line and then test individual points to see which region to shade. The graph is shown below. | |
|
| ||
|
| Now graph the region 3s + 5l ≥ 120. Graph the boundary line and then test individual points to see which region to shade. The graph is shown below. | |
|
| ||
|
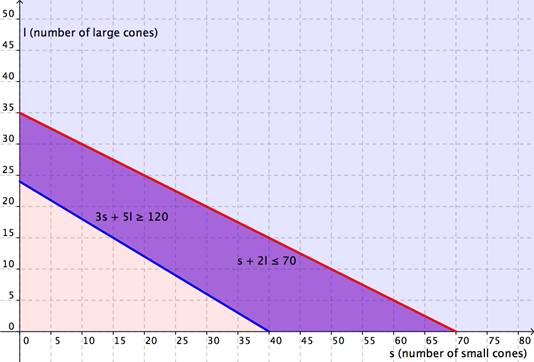
| Graphing the regions together, you find the following: | |
|
| ||
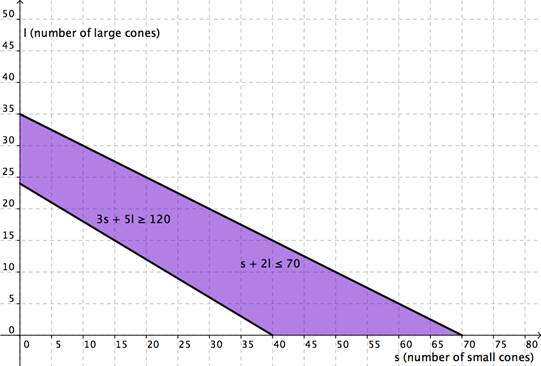
| And represented just as the overlapping region, you have:
| ||
| Answer | The region in purple is the solution. As long as the combination of small cones and large cones that Cathy sells can be mapped in the purple region, she will have earned at least $120 and not used more than 70 scoops of ice cream. | |
Summary
Systems of inequalities can be graphed on a coordinate plane. The solution set for a system of inequalities is not a single point, but rather an entire region defined by the overlapping areas of each individual inequality in the system. Every point within this region is a solution to both inequalities and thus for the whole system.
