Graphing Linear Inequalities
Learning Objective(s)
· Determine whether an ordered pair is a solution to an inequality.
· Graph an inequality in two variables.
Introduction
Linear inequalities can be graphed on a coordinate plane. The solutions for a linear inequality are in a region of the coordinate plane. A boundary line, which is the related linear equation, serves as the boundary for the region. You can use a visual representation to figure out what values make the inequality true—and also which ones make it false. Let’s have a look at inequalities by returning to the coordinate plane.
Linear inequalities are different than linear equations, although you can apply what you know about equations to help you understand inequalities. Inequalities and equations are both math statements that compare two values. Equations use the symbol =; inequalities will be represented by the symbols <, ≤, >, and ≥.
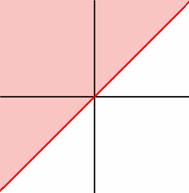
One way to visualize two-variable inequalities is to plot them on a coordinate plane. Here is what the inequality x > y looks like. The solution is a region, which is shaded.
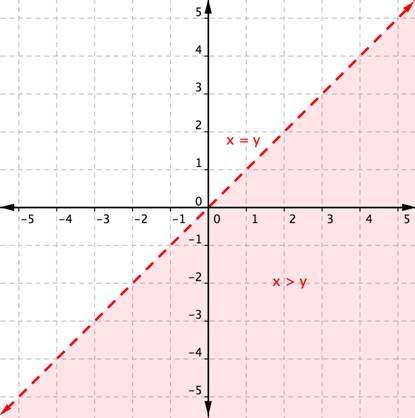
There are a few things to notice here. First, look at the dashed red boundary line: this is the graph of the related linear equation x = y. Next, look at the light red region that is to the right of the line. This region (excluding the line x = y) represents the entire set of solutions for the inequality x > y. Remember how all points on a line are solutions to the linear equation of the line? Well, all points in a region are solutions to the linear inequality representing that region.
Let’s think about it for a moment—if x > y, then a graph of x > y will show all ordered pairs (x, y) for which the x-coordinate is greater than the y-coordinate.
The graph below shows the region x > y as well as some ordered pairs on the coordinate plane. Look at each ordered pair. Is the x-coordinate greater than the y-coordinate? Does the ordered pair sit inside or outside of the shaded region?
The ordered pairs (4, 0) and (0, −3) lie inside the shaded region. In these ordered pairs, the x-coordinate is larger than the y-coordinate. These ordered pairs are in the solution set of the equation x > y.
The ordered pairs (−3, 3) and (2, 3) are outside of the shaded area. In these ordered pairs, the x-coordinate is smaller than the y-coordinate, so they are not included in the set of solutions for the inequality.
The ordered pair (−2, −2) is on the boundary line. It is not a solution as −2 is not greater than −2. However, had the inequality been x ≥ y (read as “x is greater than or equal to y"), then (−2, −2) would have been included (and the line would have been represented by a solid line, not a dashed line).
Let’s take a look at one more example: the inequality 3x + 2y ≤ 6. The graph below shows the region of values that makes this inequality true (shaded red), the boundary line 3x + 2y = 6, as well as a handful of ordered pairs. The boundary line is solid this time, because points on the boundary line 3x + 2y = 6 will make the inequality 3x + 2y ≤ 6 true.
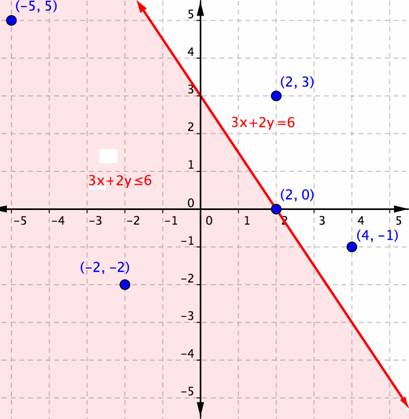
As you did with the previous example, you can substitute the x- and y-values in each of the (x, y) ordered pairs into the inequality to find solutions. While you may have been able to do this in your head for the inequality x > y, sometimes making a table of values makes sense for more complicated inequalities.
| Ordered Pair | Makes the inequality 3 x + 2y ≤ 6 a true statement | Makes the inequality 3 x + 2y ≤ 6 a false statement |
| (−5, 5) | 3(−5) + 2(5) ≤ 6 −15 +10 ≤ 6 −5 ≤ 6 |
|
| (−2, −2) | 3(−2) + 2(–2) ≤ 6 −6 + (−4) ≤ 6 –10 ≤ 6 |
|
| (2, 3) |
| 3(2) + 2(3) ≤ 6 6 + 6 ≤ 6 12 ≤ 6 |
| (2, 0) | 3(2) + 2(0) ≤ 6 6 + 0 ≤ 6 6 ≤ 6 |
|
| (4, −1) |
| 3(4) + 2(−1) ≤ 6 12 + (−2) ≤ 6 10 ≤ 6 |
If substituting (x, y) into the inequality yields a true statement, then the ordered pair is a solution to the inequality, and the point will be plotted within the shaded region or the point will be part of a solid boundary line. A false statement means that the ordered pair is not a solution, and the point will graph outside the shaded region, or the point will be part of a dotted boundary line.
| Example | ||
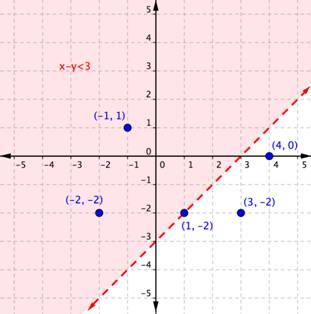
| Problem | Use the graph to determine which ordered pairs plotted below are solutions of the inequality x – y < 3. | |
|
|
| |
|
|
| Solutions will be located in the shaded region. Since this is a “less than” problem, ordered pairs on the boundary line are not included in the solution set. |
|
| (−1, 1) (−2, −2) | These values are located in the shaded region, so are solutions. (When substituted into the inequality x – y < 3, they produce true statements.) |
|
| (1, −2) (3, −2) (4, 0) | These values are not located in the shaded region, so are not solutions. (When substituted into the inequality x – y < 3, they produce false statements.) |
| Answer | (−1, 1), (−2, −2) |
|
| Example | ||
| Problem | Is (2, −3) a solution of the inequality | |
|
| y < −3x + 1 | If (2, −3) is a solution, then it will yield a true statement when substituted into the inequality y < −3x + 1. |
|
| −3 < −3(2) + 1 | Substitute x = 2 and y = −3 into inequality. |
|
| −3 < −6 + 1 | Evaluate. |
|
| −3 < −5 | This statement is not true, so the ordered pair (2, −3) is not a solution. |
| Answer | (2, −3) is not a solution. | |
| Which ordered pair is a solution of the inequality 2y - 5x < 2?
A) (−5, 1)
B) (−3, 3)
C) (1, 5)
D) (3, 3)
|
So how do you get from the algebraic form of an inequality, like y > 3x + 1, to a graph of that inequality? Plotting inequalities is fairly straightforward if you follow a couple steps.
| Graphing Inequalities
To graph an inequality: o Graph the related boundary line. Replace the <, >, ≤ or ≥ sign in the inequality with = to find the equation of the boundary line.
o Identify at least one ordered pair on either side of the boundary line and substitute those (x, y) values into the inequality. Shade the region that contains the ordered pairs that make the inequality a true statement.
o If points on the boundary line are solutions, then use a solid line for drawing the boundary line. This will happen for ≤ or ≥ inequalities.
o If points on the boundary line aren’t solutions, then use a dotted line for the boundary line. This will happen for < or > inequalities.
|
Let’s graph the inequality x + 4y ≤ 4.
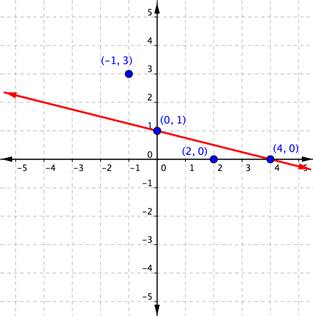
To graph the boundary line, find at least two values that lie on the line x + 4y = 4. You can use the x- and y- intercepts for this equation by substituting 0 in for x first and finding the value of y; then substitute 0 in for y and find x.
| x | y |
| 0 | 1 |
| 4 | 0 |
Plot the points (0, 1) and (4, 0), and draw a line through these two points for the boundary line. The line is solid because ≤ means “less than or equal to,” so all ordered pairs along the line are included in the solution set.
The next step is to find the region that contains the solutions. Is it above or below the boundary line? To identify the region where the inequality holds true, you can test a couple of ordered pairs, one on each side of the boundary line.
If you substitute (−1, 3) into x + 4y ≤ 4:
| −1 + 4(3) ≤ 4 |
| −1 + 12 ≤ 4 |
| 11 ≤ 4 |
This is a false statement, since 11 is not less than or equal to 4.
On the other hand, if you substitute (2, 0) into x + 4y ≤ 4:
| 2 + 4(0) ≤ 4 |
| 2 + 0 ≤ 4 |
| 2 ≤ 4 |
This is true! The region that includes (2, 0) should be shaded, as this is the region of solutions.
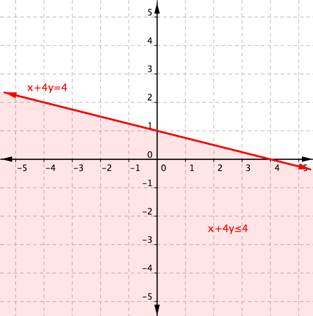
And there you have it—the graph of the set of solutions for x + 4y ≤ 4.
| Example | ||||||||
| Problem | Graph the inequality 2y > 4x – 6. | |||||||
|
|
| Solve for y. | ||||||
|
|
| Create a table of values to find two points on the line
Plot the points, and graph the line. The line is dotted because the sign in the inequality is >, not ≥ and therefore points on the line are not solutions to the inequality. | ||||||
|
|
| |||||||
|
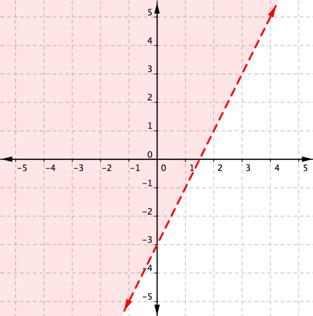
| 2y > 4x – 6
Test 1: (−3, 1) 2(1) > 4(−3) – 6 2 > –12 – 6 2 > −18 True!
Test 2: (4, 1) 2(1) > 4(4) – 6 2 > 16 – 6 2 > 10 False!
| Find an ordered pair on either side of the boundary line. Insert the x- and y-values into the inequality
Since (−3, 1) results in a true statement, the region that includes (−3, 1) should be shaded.
| ||||||
| Answer | The graph of the inequality 2y > 4x – 6 is:
| |||||||
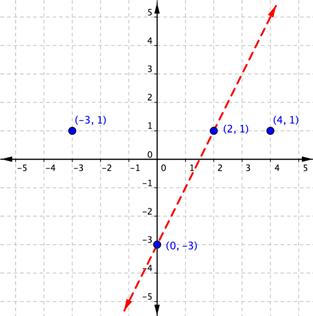
A quick note about the problem above. Notice that you can use the points (0, −3) and (2, 1) to graph the boundary line, but that these points are not included in the region of solutions, since the region does not include the boundary line!
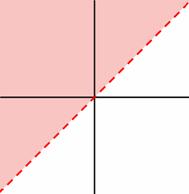
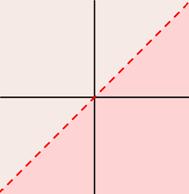
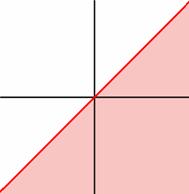
| When plotted on a coordinate plane, what does the graph of y ≥ x look like?
A)
B)
C)
D)
|
Summary
When inequalities are graphed on a coordinate plane, the solutions are located in a region of the coordinate plane, which is represented as a shaded area on the plane. The boundary line for the inequality is drawn as a solid line if the points on the line itself do satisfy the inequality, as in the cases of ≤ and ≥. It is drawn as a dashed line if the points on the line do not satisfy the inequality, as in the cases of < and >. You can tell which region to shade by testing some points in the inequality. Using a coordinate plane is especially helpful for visualizing the region of solutions for inequalities with two variables.
