Graphing Quadratic Functions
Learning Objective(s)
· Graph quadratic equations on the coordinate plane.
· Define and identify the roots of a quadratic equation.
Introduction
Next to linear functions, one of the most common types of polynomial functions we work with in algebra is the quadratic function. A quadratic function is a function that can be described by an equation of the form y = ax2 + bx + c, where a ≠ 0. No term in the polynomial function is of a degree higher than 2. Quadratic functions are useful when working with area, and they often appear in motion problems that involve gravity or acceleration.
The graphs of quadratic functions have some defining characteristics which are closely related to their symbolic forms. As we explore these graphs, we'll learn to identify their important characteristics, and see some of the many ways quadratic equations can be structured.
A quadratic function is a polynomial of degree 2, that is, the highest exponent on the variable is 2. The following are examples of quadratic functions:
![]()
![]()
![]()
The most simple and basic quadratic function has the equation ![]() . If we make a table of the values of this function, we see that the range (the y values, or output) does not behave like a linear function. In a linear function, the y value changes by the same amount each time the x value increases by 1. That's not what we see with a quadratic function:
. If we make a table of the values of this function, we see that the range (the y values, or output) does not behave like a linear function. In a linear function, the y value changes by the same amount each time the x value increases by 1. That's not what we see with a quadratic function:
| x | y = x2 |
| -3 | 9 |
| -2 | 4 |
| -1 | 1 |
| 0 | 0 |
| 1 | 1 |
| 2 | 4 |
| 3 | 9 |
The y values are not changing by a constant amount. Let's plot a few points, and see what the graph of this function looks like:
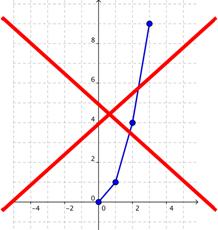
After plotting the points, it may be tempting to connect the dots with line segments, which are straight. But this is wrong, and produces a pattern that misrepresents the function.
Let's erase those straight lines and add the rest of the points:

Now we'll draw a smooth curve connecting the points.
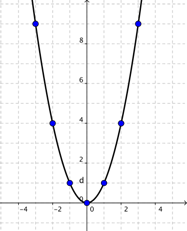
That's better! A quadratic function results in a U-shaped graph, called a parabola. The values of the function change smoothly, so the curve must be smooth as well. Now that we can really see the u-shaped nature of a parabola, let's look into this shape in detail.
Characteristics of a Parabola
The standard form of a quadratic equation is ![]() . For the example
. For the example ![]() , the value of the coefficient a is 1, and b and c are both 0. While many quadratic equations will involve non-zero values of b and c, the resulting graph will always be a parabola regardless.
, the value of the coefficient a is 1, and b and c are both 0. While many quadratic equations will involve non-zero values of b and c, the resulting graph will always be a parabola regardless.
Parabolas have many defining properties that can help us graph quadratic equations. A parabola has a special point called the vertex; this is the “turnaround” point in the U. Notice that at the vertex, the parabola changes direction:
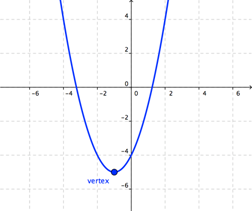
The vertex is the highest or lowest point on the curve, depending on whether the U opens up or down. For a parabola that opens upward, the vertex is the lowest point; for a parabola that opens downward, the vertex is the highest point.
All parabolic functions have a vertical axis of symmetry, an imaginary line that runs though the middle of the U-shape and divides it into two sides that are mirror images of one another. The axis of symmetry always runs through the vertex. Any two points with the same y value will be the same distance from this axis. In the interactive graph below, click and drag the point A and see how point A' moves. Notice that the axis of symmetry acts like a mirror between A and A’.
Spend some time with the interactive graph below to get more familiar with parabolas and their equations. Click and drag the red, blue, and green dots to change the values of a, b, and c in the equation y = ax2 + bx + c, and observe what happens to the parabola.
For the graph of a parabola, the leading coefficient a indicates the direction of the U shape. Use the interactive graph and check to see what happens to the parabola with values like a = 4 or a = -2. You'll see that with positive values of a (a > 0), the parabola opens upward. For negative values (a < 0), the parabola opens downward. Also notice that if a = 0, the parabola is no longer a parabola. It becomes a straight line, and the equation is now a linear equation, y = bx + c.
As a gets further from 0 in either direction, the parabola gets thinner. Conversely, as a gets closer to 0, the parabola gets wider (until it becomes the straight line at a = 0). Often we compare a parabola to the graph of ![]() . When |a| > 1, the parabola is wider than
. When |a| > 1, the parabola is wider than ![]() and when |a| < 1, the parabola is thinner than
and when |a| < 1, the parabola is thinner than ![]() . Try it with the interactive graph, looking at values like a = 2 or a = -3, and a = 0.2 or a = -0.4.
. Try it with the interactive graph, looking at values like a = 2 or a = -3, and a = 0.2 or a = -0.4.
| Which of the following quadratic equations will be a parabola that opens downward?
1. 2. 3. 4.
A) 1 and 3 only B) 2 and 4 only C) 3 only D) 2 only
|
Graphing the Parabola using the Vertex and Axis of Symmetry
For a quadratic function y = ax2 + bx + c, the x-coordinate of the vertex is always ![]() . Since the axis of symmetry passes through the vertex, this means the axis of symmetry is the vertical line
. Since the axis of symmetry passes through the vertex, this means the axis of symmetry is the vertical line ![]() . Change the values of a and b in the graph below and see where the vertex and line of symmetry are.
. Change the values of a and b in the graph below and see where the vertex and line of symmetry are.
We've seen how to graph a quadratic equation by plotting x and y values and connecting them with a smooth curve. Another way to graph a parabola is to take advantage of what we know about the vertex and the axis of symmetry. We know that the vertex is the turning point of a parabola, and we know that every point on one side of the axis of symmetry has a matching point on the other side at the same distance from the axis and with the same y-coordinate. If we find the vertex and a few points on one side, we'll have all we need to draw a graph.
| Example | |||
| Problem | Use the vertex and axis of symmetry to graph |
| |
|
|
|
| Because the coefficient of x2 is positive, the parabola opens up. |
|
|
a = 2
b = 2 |
| To find the vertex, find the values for a and b. They are the coefficients of the x2 and x terms when the quadratic equation is written in standard form. |
|
|
|
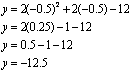
| Find the x-coordinate of the vertex by plugging a and b values into the vertex formula |
|
|
|
| Find the y-coordinate of the vertex by putting the x value into the original equation |
|
|
|
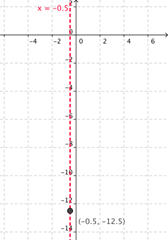
| Plot the vertex (-0.5, -12.5) and draw the axis of symmetry x = -0.5. |
|
|
|
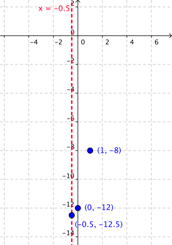
| Plot two points on one side of the axis of symmetry, such as (0, -12) and (1, -8).
Note: We can choose any x values we want; x = 0 and x = 1 are often good because the calculations tend to be easy. To find the y values, plug our chosen x values into the function and solve. |
|
|
|
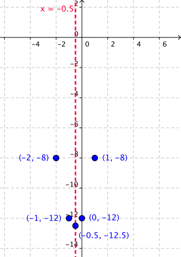
| Plot matching points across the axis of symmetry |
| Answer |
|
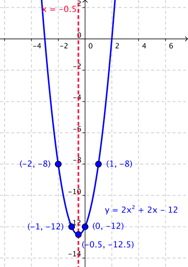
| Sketch the parabola by drawing a smooth curve connecting the points. |

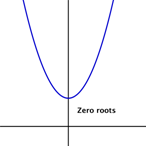
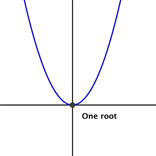
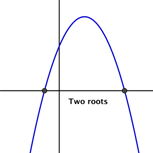
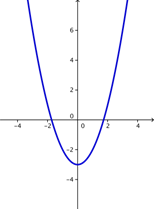
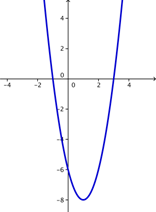
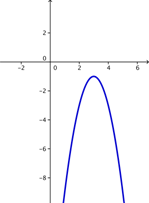
Other helpful features of a quadratic equation are the roots of a quadratic equation. The roots are the points where the parabola touches or crosses the x-axis. The x-coordinates at those points are known as the x-intercepts. (The y-coordinates are 0.) Depending on the nature of the graph (the direction of the U-shape and the location of the vertex), a quadratic function can have zero, one, or two roots. Take a moment and think about what a parabola that intersects with the x-axis in only one place would look like? In two places? What would a parabola look like that doesn’t cross the x- axis at all?
Here are some examples of parabolas with one, two, and zero roots.
To find the roots of a quadratic function, we can set the function equal to 0 (so the y-coordinate is 0) and solve the equation. Let’s try this with a simple quadratic function, with the coefficient a = 1:
| Example | |||
| Problem |
Find the roots of |
| |
|
|
|
| Since the x-intercepts occur when the value of the y-coordinate is equal to 0, we find the roots by setting the equation equal to 0. |
|
|
|
| Factor. |
|
|
0 = x - 2 x = 2
0 = x + 1 x = -1 |
| By the Zero Product Property either x – 2 = 0 or x + 1 = 0 Solve for both possibilities. |
| Answer | (2, 0) and (-1, 0) |
| This parabola has two roots. |
Because of the symmetrical nature of a parabola, knowing the roots also tells us the x-coordinate of the vertex. If there are two roots, it will be halfway between them. In this case, the vertex is an equal distance from x = 2 and x = -1, or at x = 0.5.
We can also factor a quadratic equation with the coefficient a that is not equal to 1:
| Example | |||
| Problem |
Find the roots of |
| |
|
|
|
| Begin by pulling out a common factor. |
|
|
|
| Factor the remaining expression |
|
|
0 = x + 3 or 0 = x -2 |
| Substitute 0 for y and use the zero product property. |
| Answer |
(-3, 0) and (2, 0) |
| This parabola has two roots. |
The factored form of the quadratic equation is also called the intercept form of a quadratic equation. In the intercept form of a quadratic equation, ![]() , the x-intercepts are p and q. For a function with zero roots, the equation has no intercept form. If the function has one root, p = q and the intercept form can also be written as y = a(x – p)2. As long as a quadratic equation can be factored, we can use this method to find the roots.
, the x-intercepts are p and q. For a function with zero roots, the equation has no intercept form. If the function has one root, p = q and the intercept form can also be written as y = a(x – p)2. As long as a quadratic equation can be factored, we can use this method to find the roots.
| Which of the following graphs could represent the parabola given by the quadratic equation
A) B)
C) D)
|
Summary
The graph of a quadratic function is a U-shaped curve called a parabola. It can be drawn by plotting solutions to the equation, by finding the vertex and using the axis of symmetry to plot selected points, or by finding the roots and vertex.
The standard form of a quadratic equation is ![]() . This form allows us to easily find the vertex of the parabola and the axis of symmetry by using the formula for the x-coordinate of the vertex,
. This form allows us to easily find the vertex of the parabola and the axis of symmetry by using the formula for the x-coordinate of the vertex, ![]() .
.
The intercept form of a quadratic equation is y =![]() . The roots, or x intercepts, of the parabola are (p, 0) and (q, 0). Not all quadratic equations will have an intercept form because not all parabolas have a root.
. The roots, or x intercepts, of the parabola are (p, 0) and (q, 0). Not all quadratic equations will have an intercept form because not all parabolas have a root.
