Proportional Functions
Learning Objective(s)
· Define proportional function.
· Explain the parts of the standard proportional function equation.
· Recognize and describe the characteristics of a proportional function graph.
Imagine you are with your 6-year old niece at the zoo on a sunny summer afternoon. She’s at that age when she insists on counting everything she sees. As you are walking through the parking lot, she wants to count all the tires on the cars. It’s cute, but it really slows you down, so you tell her there’s a trick she can use. She can count just the number of cars and then multiply it by 4 because the number of tires is related in a predictable way to the number of cars. She thinks that’s cool, and you finally manage to get inside the zoo.
Now your niece decides that she wants to count all the legs on the zoo animals. Can you speed things up by having her just count heads and then multiply by a fixed amount to get the number of legs? No, because different animals have different numbers of legs—the lions have 4 legs, the flamingos have 2, and the snakes don’t have any at all. As the number of animals grows, the number of legs doesn’t increase in a steady or predictable pattern. You sigh and buy yourself an extra large box of popcorn to pass the time.
Both of these situations are relations—they each have an independent, input variable (the number of cars or the number of animals) and a dependent, output variable (the number of tires or of legs). But the first relation is an example of a special kind of relation, called a proportional function. A function is proportional when the output is equal to the input multiplied by a constant. The number of tires is equal to the number of cars times 4. If there are no cars in the parking lot, then the number of tires is 4 times 0, or 0. If there are 3 cars in the lot, the number of tires is 4 times 3. If there are 10 cars, then there are 4 times 10 tires.
In any function, the amount of one quantity is dependent on the amount of another. In the car example, the number of tires is dependent on the number of cars in the lot. Algebraically, we can represent this relationship with an equation.
tires = 4 • cars
The number 4 tells us the rate at which cars and tires are related. All proportional functions use a rate in the same way. We call the rate the constant of variation, or the constant of proportionality. It’s a constant because this number does not change within the function. Because the input and output are linked by a constant, changes in the independent variable cause the dependent variable to change in a proportional, steady way. This proportional relationship gives proportional functions their name.
We can use the car and tire equation as the basis for writing a general algebraic equation that will work for all proportional functions. In our example, tires is the output, 4 is the constant, and cars is the input. Let’s plug those generic terms into the equation. We get output = constant • input. That’s the formula for all proportional functions.
tires = 4 • cars
output = constant • input
Let’s change it from a verbal formula to a symbolic one—it’ll be quicker to write. The output of a function is also known as the dependent variable and is generally represented symbolically as y. The input is called the independent variable, represented by the symbol x. Let’s represent the constant with the letter k. Now we’ll put those symbols into the equation.
tires = 4 • cars
output = constant • input
y = kx
And we’ve done it! All proportional functions can be described by the equation y = kx.
Which of the following equations represent proportional functions?
Equation 1: ![]()
Equation 2: ![]()
Equation 3: ![]()
Equation 4: ![]()
A) Equation 1
B) Equations 2 and 3
C) Equation 4
D) Equations 2 and 4
Proportional Functions in Tables and Sets of Ordered Pairs
Like other functions, proportional ones can be described and explored using tables and sets of ordered pairs. Let’s see how tables of proportional functions can be useful.
Mary works at a roadside stand on the family chicken farm, selling eggs for $1.99 per carton on busy weekends. When customers buy a lot of cartons at once, she has to add up the totals with a pencil and paper, and she worries about making mistakes. Lucky for Mary, this is a proportional relationship—the output (total cost) equals the input (number of cartons) times a constant (the price per carton). She can use the proportional function equation to make a pricing table to use as a shortcut.
| Number of cartons | Total price |
|
|
|
|
|
|
|
|
|
|
|
|
|
|
|
|
|
|
Now she just has to use the equation to calculate the values and fill in the table. Remember, the proportional function equation is y = kx. So in this case, total cost = carton price • number of cartons. Total cost = 1.99 • number of cartons.
| Number of cartons | Total price |
| 1 | $1.99 |
| 2 | $3.98 |
| 3 | $5.97 |
| 4 | $7.96 |
| 5 | $9.95 |
| 6 | $11.94 |
Mary can also write the possible inputs and outputs of this function as ordered pairs. One carton of eggs costs $1.99 and can be represented as (1, 1.99). Two cartons cost $3.98, or (2, 3.98), and so forth.
(1, 1.99)
(2, 3.98)
(3, 5.97)
(4, 7.96)
(5, 9.95)
(6, 11.94)
Notice that in each ordered pair the y value is 1.99 times the x value.
What is the constant of the function shown in the table below?
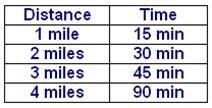
A) 15
B) 1
C) Distance
D) Time
When proportional functions are graphed, they display some distinctive characteristics—all proportional functions form a straight line that passes through the origin.
Let’s graph the egg cost/carton function we’ve been discussing.
This is a discrete function—it is made up of individual points, because the farm stand only sells whole cartons of eggs. But we can see that all of the points are evenly spaced, and appear to lie on a straight line. We can also see that although it isn’t plotted, the point (0,0) satisfies the function—the cost of 0 cartons would be 0 dollars.
Now let’s look at the graph of a continuous proportional function and see how they compare. Imagine a faucet pours water into a tub at a rate of 2.5 gallons per minute. The amount of water in the tub varies directly with the amount of time the faucet has been running. We can represent the relationship between the time and the water in the tub with the following formula:
Total gallons = 2.5 gallons/minute • time in minutes
Using g to represent total gallons of water and t to represent time, we may abbreviate this relationship as g = 2.5t, which looks very similar to the standard formula for proportional functions, y = kx.
Let’s make a table to chart the relationship of time versus the amount of water in the tub. After 1 minute, 2.5 gallons is in the tub. After 2 minutes, the total is 5 gallons, and so on. To find the total amount of water in the tub at any time, we can multiply the time by 2.5 gallons per minute. Six minutes should give us enough points to make a useful graph.
| Time | Total Gallons |
| 1 | 2.5 |
| 2 | 5.0 |
| 3 | 7.5 |
| 4 | 10.0 |
| 5 | 12.5 |
| 6 | 15.0 |
Now we can graph those points.
This time we will use a line to connect the points, because both time and water increase continuously. And look—the points lie on a straight line that begins at the origin and rises at a steady angle, just like the last graph. When the variables in a function change at a constant rate like this, they have a proportional relationship. This steady rate of change is called the constant of variation.
Summary
In a proportional function, the output is equal to the input times a constant. The constant is a rate that describes the pace at which the variables change. Because this rate, or constant of variation, is steady and unchanging, proportional functions have a distinctive equation and graph. All proportional functions have the formula y = kx and form a straight line that ends at or passes through the origin.
