Representing Patterns
Learning Objective(s)
· Use tables and graphs to identify and represent patterns.
Introduction
Mathematical tables and graphs are a good way to represent patterns. They organize data and can reveal relationships, making it easier to write equations that describe the patterns.
Kim owns a business that rents out tables and chairs for parties. For big events, she sets up tables end to end in long rows. Every individual table seats 2 people on each side. Two more people can sit on the ends of the rows.
Kim would like to know how many chairs to get out of storage to set around rows of tables of varying lengths. We’ll create a mathematical table that will show Kim this information.
The standard form of a mathematical table puts the independent value in the first column and the dependent value in the second column. In math, the independent value is the variable being manipulated. The dependent value is the variable that is affected by changes in the independent value.
| Independent Value | Dependent Value |
|
|
|
|
|
|
|
|
|
|
|
|
In this case, the independent value is the number of tables in a row—that changes with the size of the room. The dependent value is the number of chairs, which increases or decreases depending on how many tables are used.
So let’s start filling out the chart. A one table row will need 6 chairs—2 on each side, plus the additional chair at each of the two ends. Put a second table end to end with the first, and Kim will need 4 chairs for each side of the row, plus 2 more for ends of the row, for a total of 10 chairs. A third table added to the row will require 4 more chairs, 2 on each side. That brings the total to 14. A fourth table means another 4 chairs, or 18 altogether.
| Number of Tables | Number of Chairs |
| 1 | 6 |
| 2 | 10 |
| 3 | 14 |
| 4 | 18 |
Now that we’ve got the mathematical table partially filled in, let’s see if we can find the relationship between the independent and dependent values.
We can see that for every dinner table Kim adds to the first one, she needs four more chairs. This pattern will continue no matter how many tables are added to a row.
From Tables to Equations
The number of chairs needed is simple enough for Kim to calculate when there are just a few tables. However, if she wants to find the number of chairs needed for a setting that uses a lot of tables, this method would take a long time. She needs a mathematical shortcut to find the number of chairs needed for any number of tables.
Let’s see if we can come up an equation to do that. In algebra, we usually call the independent value x, and use y for the dependent variable. So we’ll use y for the number of chairs and x for the number of tables.
Each table needs 4 chairs, 2 on each side. We can write that down as ![]() . But that’s only part of the story. Every row of tables also needs 2 more chairs, one on each end. So we need to add 2 more chairs to the formula:
. But that’s only part of the story. Every row of tables also needs 2 more chairs, one on each end. So we need to add 2 more chairs to the formula: ![]() .
.
Is that it? Let’s compare with the table we made. The table says that 3 tables take 14 chairs. If we substitute 3 for the number of tables in our equation, we get ![]() . The equation works.
. The equation works.
Kim can find the number of chairs needed for any situation by multiplying the number of tables by 4 and then adding 2.
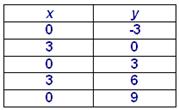
Based on the numbers in this table, which expression describes the value of y in terms of x?
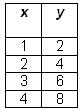
A) y = 2x
B) y = ![]()
C) y = x2
D) y = x + 1
Exploring Patterns with Graphs
Another way to study and predict patterns is with graphs. Let’s look again at the table we made to help Kim figure out how many chairs she needs.
| Number of Tables | Number of Chairs |
| 1 | 6 |
| 2 | 10 |
| 3 | 14 |
| 4 | 18 |
The values in a table can be written as ordered pairs, which can then be plotted as points on a graph. Remember, the independent value is the x-coordinate and the dependent value is the y-coordinate. The ordered pairs represented by Kim’s tables and chairs are: (1, 6), (2, 10), (3, 14), (4, 18).
These points can now be graphed on a coordinate plane.

Notice that the 4 points fall on a straight line. That line can be used to find additional points that are part of the pattern. For example, if we find the point on the line where x, the number of tables, equals 5, we see that y, the number of chairs needed, will be 22.
We can also work the other way. We can turn the graph of a pattern into a table that will help us investigate the mathematical relationship between the values.
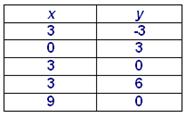
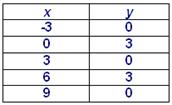
Here is a different graph with four labeled points.
We can transfer those points to a table putting the x-values in the first column and the y-values into the second column. We’ll work from the smallest value of x to the largest. So we start with the point (1, 1), then (2, 5), next (3, 9), and finally (4, 13).
| Independent Value (x) | Dependent Value (y) |
| 1 | 1 |
| 2 | 5 |
| 3 | 9 |
| 4 | 13 |
Converting the graph into a table will make it easier to see how changes in the independent value affect the dependent value and find the details of the underlying pattern.
Discrete and Continuous Patterns
Many patterns can be represented on the coordinate plane. It’s important to remember the details of a situation, however, to avoid nonsense values.
Let’s go back to the graph we created to describe Kim’s tables and chairs pattern.
We drew a line through the plotted points to help us find the number of chairs needed for different numbers of tables. But we must realize that only whole number coordinates are actually possible. Kim cannot set up half of a table or one fourth of a chair.
This is a discrete pattern, where a pattern changes in increments and not continuously. Not all numbers that solve the equation that describes the pattern actually make sense.
Some situations do represent continuous patterns. In these cases, all the points on a line that graphs the pattern are accurate.
For example, consider the graph of a moving express train traveling at 55 mph for several hours without stopping. The time of travel in hours is the independent variable, plotted on the x-axis. The distance traveled in miles is the dependent variable, plotted on the y-axis.
The point (0, 0) represents the start of the trip, just before the train starts moving. The point (1, 55) shows the situation after one hour—the train has gone 55 miles. In two hours, the train has gone another 55 miles, or 110 miles altogether. This can be plotted with a point at (2, 110).
A line that connects all three points can be used to accurately determine how far the train has traveled at any instant between 0 and 2 hours. Because both the independent value (time) and dependent value (distance) of this pattern change constantly, this is a continuous pattern. All the points on the line make sense.
Summary
We have now learned how to represent patterns mathematically using tables, graphs, and equations. We have also seen that these tools can help us describe and predict parts of patterns beyond what we see and measure directly.
